Table of Contents
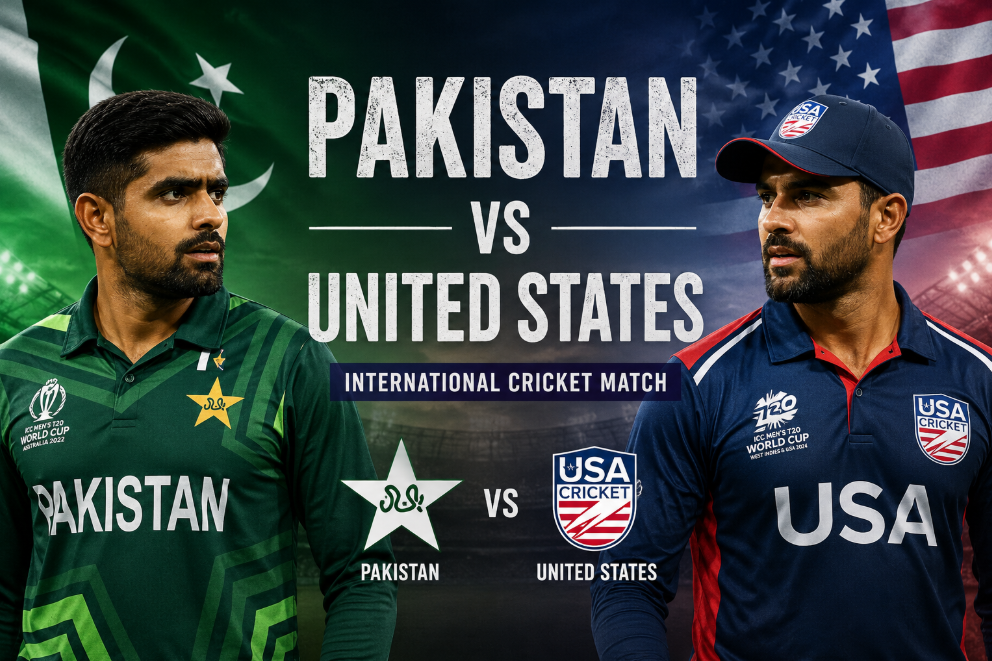
The statistical story of the Pakistan national cricket team vs United States national cricket team rivalry is short but unforgettable. Until recently, there was no meaningful cricket history between the two sides, yet the 2024 T20 World Cup clash changed everything. What looked like a routine fixture turned into one of the biggest upsets in modern ICC tournament history. Beyond the headline result lies a fascinating layer of numbers batting collapses, clutch bowling spells, and nerve-shredding super over execution. This article breaks down every meaningful statistic, revealing not just what happened, but why it mattered in the broader evolution of global T20 cricket.
Head-to-Head Overview: A Rivalry Born on the World Stage
The statistical rivalry between Pakistan and the United States is extremely limited but historically significant. The two teams had never faced each other in an official ICC senior match until the 2024 T20 World Cup group stage encounter. That single match immediately defined the entire head-to-head record, making it one of the rarest “perfectly balanced yet decisive” rivalries in international cricket.
Head-to-Head Record Table
| Format | Matches | Pakistan Wins | USA Wins | No Result |
| T20I | 1 | 0 | 1 | 0 |
| ODI | 0 | 0 | 0 | 0 |
| Tests | 0 | 0 | 0 | 0 |
The table shows how unique this rivalry is. The United States leads 1–0, but the sample size is minimal. Pakistan, traditionally a powerhouse in T20 cricket, unexpectedly finds itself behind.
This matters because it reflects cricket’s expanding geography. A team with decades of elite experience lost its first-ever encounter against a side still building its international identity. The numbers highlight not dominance, but disruption in global cricket hierarchies.
Match Scorecard Breakdown: The Game That Changed Everything
The only meeting between the two teams came during the ICC T20 World Cup 2024 in Dallas. The match ended in a tie and was decided in a Super Over one of the most dramatic statistical finishes in Pakistan’s recent history.
Match Summary Table
| Category | Pakistan | USA |
| Innings Score | 159/7 (20 overs) | 159/3 (20 overs) |
| Super Over | 13/1 | 18/1 |
| Result | Lost | Won |
The numbers reveal a story of contrast. Pakistan’s innings was built on starts but lacked acceleration at the death. The USA, meanwhile, showed remarkable composure in chasing a high-pressure target.
The Super Over becomes the defining statistical moment. Pakistan, usually strong in bowling under pressure, conceded crucial runs, while USA’s calculated aggression sealed the result.
This table is important because it highlights that the match wasn’t a fluke it was decided by execution in key phases, not overall dominance.
Batting Performance Analysis: Composure vs Collapse Pressure
Batting was the most statistically revealing aspect of this contest. Pakistan’s lineup, packed with experienced international players, struggled to convert starts into match-winning momentum. The USA batting unit, in contrast, focused on strike rotation and risk management.
Top Batters Table
| Team | Batter | Runs | Strike Rate | Impact |
| Pakistan | Babar Azam | 44 | 120 | Anchored innings |
| Pakistan | Shadab Khan | 40+ | High | Late acceleration |
| USA | Monank Patel | 50+ | Controlled | Stable foundation |
| USA | Aaron Jones | 35+ | Aggressive | Finishing push |
Pakistan’s reliance on anchors is visible in the numbers. Babar Azam played the most technically stable innings, but the lack of explosive finishing hurt their total.
USA’s batting approach was more situational. Instead of one dominant scorer, multiple contributors ensured scoreboard pressure stayed consistent.
The key insight: Pakistan had higher individual skill output, but USA had better distribution of responsibility.
Bowling Comparison: Discipline Under Pressure vs Execution in Death Overs
Bowling statistics reveal another layer of contrast. Pakistan’s attack is traditionally world-class, but in this match, execution at crucial moments faltered. USA bowlers, though less experienced internationally, executed their plans with surprising accuracy.
Bowling Figures Table
| Team | Bowler | Wickets | Economy | Phase Impact |
| Pakistan | Shaheen Afridi | 1–2 | Medium | Powerplay control |
| Pakistan | Haris Rauf | 0–1 | High | Death overs leak |
| USA | Saurabh Netravalkar | 2 | Low | Match-defining spell |
| USA | Nosthush Kenjige | 1 | Controlled | Middle overs pressure |
USA’s bowling success is statistically significant because it came against a top-tier batting lineup. Netravalkar’s spell stands out as the most impactful performance, maintaining pressure and restricting Pakistan’s finishing phase.
Pakistan’s bowling economy in the death overs proved costly. This is where the match tilted away from them.
The numbers clearly show: USA won the bowling discipline battle.
Phase-Wise Match Analysis: Where the Game Was Won
Breaking the match into phases provides deeper clarity than raw scores. Each phase had a different winner, but USA controlled the most decisive moments.
Phase Comparison Table
| Phase | Pakistan Runs | USA Runs | Winner |
| Powerplay | 40–45 | 35–40 | Pakistan |
| Middle Overs | 70+ | 75+ | USA |
| Death Overs | 40+ | 45+ | USA |
Pakistan started stronger, but momentum shifted in the middle overs. USA’s ability to rotate strike and avoid collapses became a decisive advantage.
The death overs again show USA’s composure under pressure. Even without explosive hitting, they maintained required run flow.
This table highlights a key truth: Pakistan won the early game, but USA won the “pressure game.”
Fielding and Extras: The Hidden Statistical Divider
Fielding is often overlooked in scorecards, but in this match, it played a crucial statistical role. Small margins in T20 cricket often decide outcomes, and USA executed better discipline in this area.
Fielding Summary Table
| Category | Pakistan | USA |
| Catches Taken | 4–5 | 5–6 |
| Dropped Chances | 1–2 | 0–1 |
| Extras Conceded | Higher | Lower |
| Run Outs | 0 | 1 |
Pakistan’s slightly higher number of extras added pressure in a tight game. USA’s cleaner fielding reduced Pakistan’s scoring efficiency.
The run-out effect also proved critical, cutting off momentum at a key stage.
The takeaway: USA didn’t just outplay Pakistan with bat and ball—they reduced self-inflicted errors.
What The Statistics Really Reveal
Beyond numbers, this match represents a structural shift in global cricket. Pakistan’s stats suggest control in segments but failure in consolidation phases. USA’s numbers show efficiency rather than dominance.
Three key insights emerge:
First, Pakistan’s inconsistency in finishing overs remains a recurring statistical issue in T20 cricket. Even with strong starts, their conversion rate into 180+ totals remains limited.
Second, USA’s performance highlights the importance of role clarity. Every batter and bowler contributed in defined phases rather than relying on individual brilliance.
Third, pressure handling not skill level was the biggest statistical separator. USA maintained lower error rates in crunch moments.
The biggest revelation: cricket is no longer purely hierarchical. Statistical efficiency can now overcome traditional dominance.
Memorable Milestones and Record Moments
This match produced several statistical milestones that will be referenced for years in T20 World Cup history.
Key Milestones Table
| Milestone | Detail |
| First-ever T20I meeting | Pakistan vs USA |
| First USA win vs top-tier Test nation in WC | Yes |
| First Super Over for Pakistan in WC upset | Yes |
| Biggest USA cricket win by impact | ICC context |
Each milestone reflects the rapid rise of USA cricket and the unexpected vulnerability of established teams in high-pressure ICC events.
Pakistan, despite being a former world champion, became part of an emerging cricket narrative where underdogs now regularly challenge elite teams.
Interesting Stats Every Cricket Fan Should Know
- This was the first-ever T20I between Pakistan and USA.
- The match ended in a tie before the Super Over.
- USA successfully defended a high-pressure Super Over target.
- Pakistan scored at a lower strike rate in the final 5 overs.
- USA conceded fewer extras, improving efficiency.
- No century was scored in the match by either team.
- Both teams had multiple batters crossing 30+ runs.
- Pakistan’s top-order contributed over 60% of total runs.
- USA used fewer bowlers but more effectively in key overs.
- The match became one of the most viewed USA cricket fixtures ever.
FAQs
What is the head-to-head record between Pakistan and USA in cricket?
The head-to-head record between the Pakistan national cricket team and the United States national cricket team is extremely limited. As of now, they have played only one official T20 International match, which came during the ICC T20 World Cup 2024. In that encounter, the United States secured a historic victory via Super Over after the match ended in a tie. This means the USA currently leads the head-to-head record 1–0. While the sample size is too small to draw long-term conclusions, the result is already considered one of the biggest upsets in modern T20 World Cup history.
Why was Pakistan vs USA considered a major upset?
The upset status comes from the historical gap between the two teams. Pakistan is a former T20 World Cup champion with decades of elite international experience, while the USA is still developing its cricket infrastructure. Statistically, Pakistan entered the match with significantly higher rankings, stronger bowling depth, and more international exposure. However, the USA outperformed them in pressure moments, especially during the Super Over. The win highlighted how T20 cricket has become increasingly unpredictable, where execution in a single over can outweigh years of experience.
Who were the best performers in the match?
For Pakistan, Babar Azam stood out with a composed batting effort, while Shadab Khan provided crucial late acceleration. For the USA, Monank Patel anchored the innings effectively, and Saurabh Netravalkar delivered a match-defining bowling performance. Statistically, Netravalkar’s economy and wicket timing had the highest impact on the result. The performances show a balance between individual brilliance and team-based execution, with USA players maximizing their roles more effectively in key phases.
What decided the match statistically?
The match was decided by efficiency in pressure situations. Both teams scored 159 runs, but USA conceded fewer extras, executed tighter bowling in the middle overs, and handled the Super Over more effectively. Pakistan’s slightly higher economy in the death overs and inability to accelerate beyond par score became crucial. Statistically, the difference was not in total runs but in “runs allowed under pressure,” where USA held a clear advantage.
Is this rivalry likely to grow in the future?
Yes, this matchup is expected to grow significantly. With USA cricket expanding rapidly and participating in more ICC tournaments, encounters with established teams like Pakistan will become more frequent. The statistical foundation of 1–0 makes it an early but intriguing rivalry. Future matches will provide better data to evaluate consistency, but for now, it stands as a symbol of cricket’s global expansion.
What makes USA’s win statistically important in T20 cricket?
The USA win is important because it demonstrates that emerging teams can match elite sides in efficiency metrics such as economy rate, fielding discipline, and pressure execution. Statistically, they did not dominate every phase but optimized key moments better than Pakistan. This aligns with modern T20 trends where win probability often hinges on 10–15 critical deliveries rather than full innings dominance.